

Complete Spread Table for All Products
XM’s Latest Spreads & Spread Values Converted to Currency (Updated Daily)
The spread data shown in this guide is pulled directly from MT5 every day to ensure you always have the most up-to-date information.
XM’s spread (pips) for each product changes daily, and the most tradeable assets shift from day to day as well. That’s why in this article, we automatically pull the latest XM spreads from MT5 every day and display a table that calculates the spread value of each product in monetary terms.
We also cover everything from the basics of spreads in Forex trading to the unique characteristics of XM’s spreads, how to calculate spread costs, and trading fees for the Shares account. For XM’s official pip value calculator, access it via the button below.
Contents
What Is a Spread in Forex Trading?
A spread in Forex trading refers to the difference between the Bid (sell) price and the Ask (buy) price of a financial instrument. Spreads fluctuate constantly depending on factors such as market liquidity, trading volume, and market volatility.

In the foreign exchange market, spreads are typically quoted in pips and represent the primary source of revenue for brokers and banks. The narrower the spread, the lower your trading costs — creating a more favourable trading environment for traders.
What Are “Pips” — the Unit of Spread?
A pip is the unit of price movement for a financial instrument. In Forex trading, the smallest unit of price change is called a “Point,” and a value 10 times that is expressed as a “pip.” For example, if the EUR/USD price moves from 1.14235 to 1.14245, that is a movement of 1 pip.
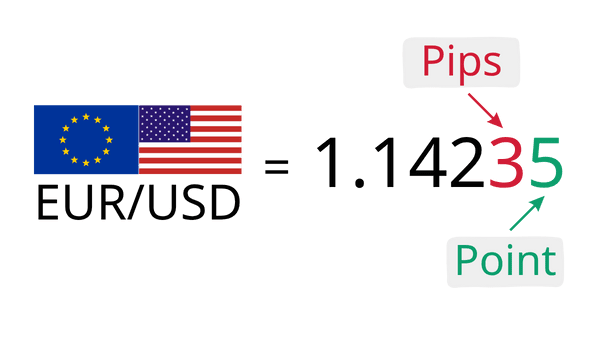
For GOLD — one of the most actively traded instruments in the market — the smallest unit of price movement is the second decimal place, making the first decimal place the pip. If the price moves from 3025.50 to 3025.60, that is equivalent to a 1 pip movement.
Forex traders use pips to measure price movements, profits and losses, and spread sizes. In other words, pips are a critical metric for traders to accurately understand market movements — making it essential to have a solid grasp of this concept.
Key Characteristics of XM Spreads
XM offers a versatile trading environment tailored to meet traders’ needs — including a floating spread system, precise pricing with fractional pips, and flexible spread settings by account type. Here, we explain the defining characteristics of XM’s spreads.
Floating Spread System & Fractional Pip Pricing
XM uses a floating spread system to provide traders with a superior trading environment. Unlike fixed spreads, XM’s floating spreads expand and contract in line with market volatility — just like the interbank market. During normal market conditions, floating spreads tend to be tighter than fixed spreads, helping to reduce average trading costs.
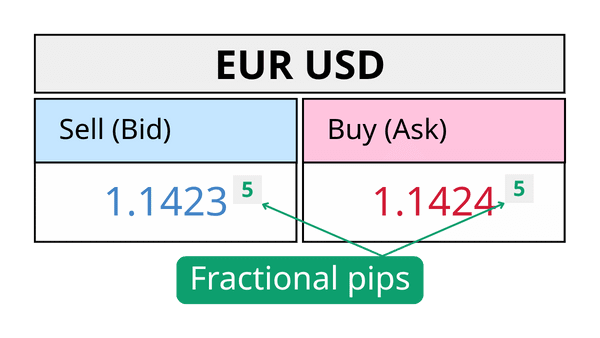
XM also receives precise pricing from Liquidity Providers (LPs), and through “fractional pip pricing,” prices can be displayed in increments smaller than 1 pip. By showing prices to 3–5 decimal places, traders can capture profits even from minor price movements — making it an ideal environment for short-term traders.
Spreads & Trading Fees That Vary by Account Type
XM’s spreads differ depending on your account type (Standard or Ultra Low). The Ultra Low account offers industry-leading tight spreads, while the Standard account gives you access to deposit bonuses, the XM Traders Club (XMC), and a range of high-quality bonus promotions.
With the exception of the Shares account (designed exclusively for stock trading), all XM account types charge zero trading commissions. This gives you a simple, transparent cost structure: spread = trading cost.
Ultra-Tight Spreads on the XM Ultra Low Account
The XM Ultra Low account is designed for traders who engage in short-term strategies such as scalping and day trading, and for those looking to minimise trading costs. It offers ultra-tight minimum spreads from 0.6 pips with zero commissions, delivering consistently stable average spreads — especially on GOLD and EURUSD.
With the Ultra Low account’s exceptionally tight spreads, you can trade profitably even on small price movements — making it the ultimate environment for scalping and day trading.
▼ Complete Guide to the XM Ultra Low Account

How to Calculate Spread Costs (Pip Value)
Here is the formula for calculating how much a spread (in pips) is worth in monetary terms:
That said, you don’t need to calculate this manually. XM provides a dedicated online calculator that instantly computes your “Pip Value.” Using this calculator, you can easily work out the pip value for any Forex product based on your trade size.
The “Pip Value” is the monetary amount that 1 pip represents in your account currency. Multiply the pip value by the spread (in pips) to get your total spread cost.
Access XM’s calculator via the button below. Use it to estimate your exact costs before entering a trade and plan your strategy with confidence.
Simply enter your trading conditions into the Forex Calculator and it will instantly display the “Pip Value” for each financial instrument.
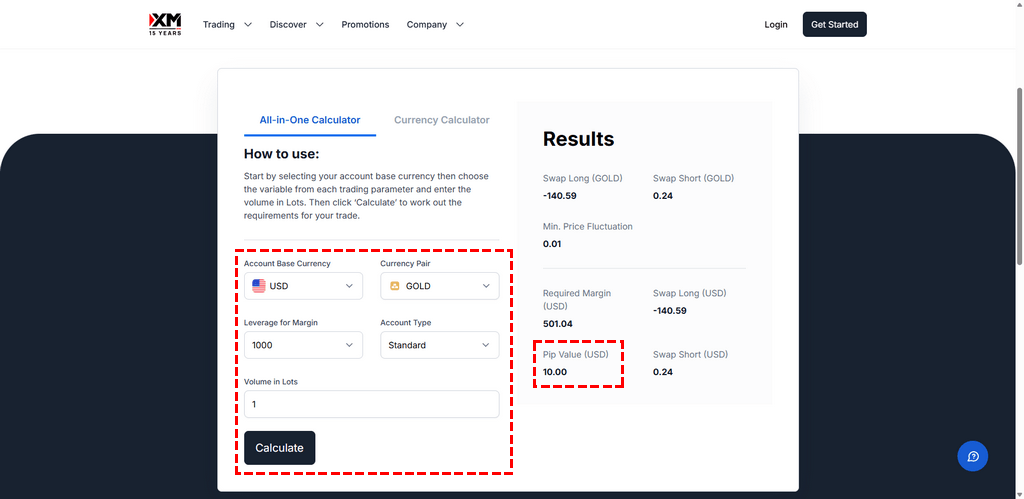

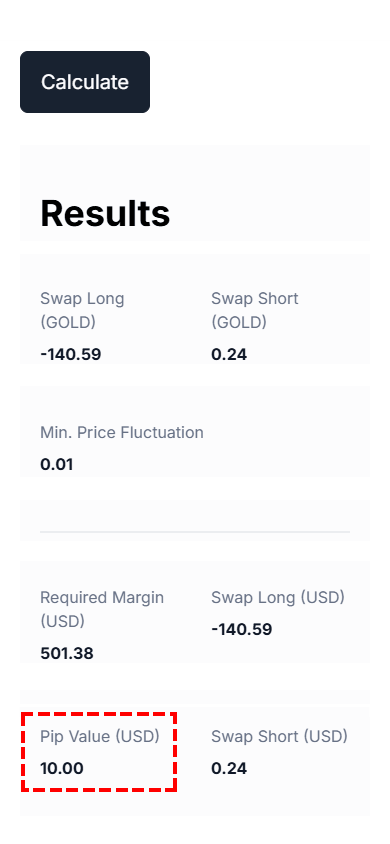
XM’s Forex Calculator is limited to Forex, Gold, and Silver products, and does not directly display spread values converted into currency amounts. That’s why we’ve developed an automatic spread value calculator app that covers all XM products. If you’d like to check XM’s spread costs directly, our browser-based app is available right below — free to use anytime.
Latest Spread Table & Spread Costs for All XM Products (Updated Daily)
In this section, you can check the latest spreads for all products offered by XM, including spread values converted to USD. Lot sizes are fully adjustable, and you can easily compare two account types — Standard and Ultra Low — side by side.
XM Major Currency Pairs Spread Table
The latest spreads and spread costs for major currency pairs available to trade on XM. The spreads in this table are updated automatically every day at 19:20, pulling data directly from MT5. You can freely set your lot size and base currency — make the most of this table.
| Currency Pair | Standard | Ultra Low |
|---|---|---|
| EURUSDEuro/US Dollar | 2.2 pips | 1.3 pips |
2.20 USD | 1.30 USD | |
| GBPUSDBritish Pound/US Dollar | 2.6 pips | 1.5 pips |
2.60 USD | 1.50 USD | |
| USDJPYUS Dollar/Japanese Yen | 2.6 pips | 1.5 pips |
1.65 USD | 0.95 USD | |
| AUDUSDAustralian Dollar/US Dollar | 2.6 pips | 1.7 pips |
2.60 USD | 1.70 USD | |
| NZDUSDNew Zealand Dollar/US Dollar | 3.1 pips | 2.3 pips |
3.10 USD | 2.30 USD | |
| USDCADUS Dollar/Canadian Dollar | 3.2 pips | 2.5 pips |
2.28 USD | 1.78 USD | |
| USDCHFUS Dollar/Swiss Franc | 3.0 pips | 1.2 pips |
3.66 USD | 1.46 USD | |
| EURGBPEuro/British Pound | 2.6 pips | 2.2 pips |
3.48 USD | 2.94 USD | |
| EURAUDEuro/Australian Dollar | 4.0 pips | 3.2 pips |
2.84 USD | 2.27 USD | |
| EURCADEuro/Canadian Dollar | 3.6 pips | 2.6 pips |
2.56 USD | 1.85 USD | |
| EURNZDEuro/New Zealand Dollar | 4.9 pips | 4.0 pips |
2.81 USD | 2.29 USD | |
| EURCHFEuro/Swiss Franc | 3.4 pips | 2.9 pips |
4.15 USD | 3.54 USD | |
| GBPAUDBritish Pound/Australian Dollar | 3.8 pips | 3.1 pips |
2.70 USD | 2.20 USD | |
| GBPNZDBritish Pound/New Zealand Dollar | 8.0 pips | 6.7 pips |
4.58 USD | 3.84 USD | |
| GBPCADBritish Pound/Canadian Dollar | 5.2 pips | 3.4 pips |
3.70 USD | 2.42 USD | |
| GBPCHFBritish Pound/Swiss Franc | 4.6 pips | 3.3 pips |
5.62 USD | 4.03 USD | |
| AUDNZDAustralian Dollar/New Zealand Dollar | 4.5 pips | 3.6 pips |
2.58 USD | 2.06 USD | |
| AUDCADAustralian Dollar/Canadian Dollar | 3.7 pips | 2.9 pips |
2.63 USD | 2.07 USD | |
| AUDCHFAustralian Dollar/Swiss Franc | 3.5 pips | 1.9 pips |
4.27 USD | 2.32 USD | |
| CADCHFCanadian Dollar/Swiss Franc | 4.5 pips | 2.5 pips |
5.49 USD | 3.05 USD | |
| EURJPYEuro/Japanese Yen | 3.3 pips | 2.2 pips |
2.10 USD | 1.40 USD | |
| GBPJPYBritish Pound/Japanese Yen | 3.5 pips | 2.3 pips |
2.23 USD | 1.46 USD | |
| AUDJPYAustralian Dollar/Japanese Yen | 3.7 pips | 2.6 pips |
2.35 USD | 1.65 USD | |
| NZDJPYNew Zealand Dollar/Japanese Yen | 4.0 pips | 3.0 pips |
2.54 USD | 1.91 USD | |
| CHFJPYSwiss Franc/Japanese Yen | 4.0 pips | 2.9 pips |
2.54 USD | 1.85 USD | |
| CADJPYCanadian Dollar/Japanese Yen | 4.2 pips | 3.3 pips |
2.67 USD | 2.10 USD |
XM Minor & Cross Currency Pairs Spread Table
The latest spreads and spread costs for minor and cross currency pairs available to trade on XM.
| Currency Pair | Standard | Ultra Low |
|---|---|---|
| SGDJPYSingapore Dollar/Japanese Yen | 23.3 pips | 12.8 pips |
14.82 USD | 8.14 USD | |
| USDNOKUS Dollar/Norwegian Krone | 196.5 pips | 176.3 pips |
20.88 USD | 18.73 USD | |
| USDPLNUS Dollar/Polish Zloty | 49.7 pips | 37.7 pips |
13.11 USD | 9.95 USD | |
| USDSEKUS Dollar/Swedish Krona | 143.0 pips | 135.3 pips |
14.59 USD | 13.80 USD | |
| USDTRYUS Dollar/Turkish Lira | 496.0 pips | 446.0 pips |
10.16 USD | 9.14 USD | |
| USDCNHUS Dollar/Chinese Yuan | 3.9 pips | 3.4 pips |
5.82 USD | 5.08 USD | |
| USDMXNUS Dollar/Mexican Peso | 241.7 pips | 181.7 pips |
14.03 USD | 10.55 USD | |
| USDSGDUS Dollar/Singapore Dollar | 21.8 pips | 12.7 pips |
17.12 USD | 9.97 USD | |
| USDZARUS Dollar/South African Rand | 18.2 pips | 16.4 pips |
11.22 USD | 10.11 USD | |
| USDDKKUS Dollar/Danish Krone | 39.9 pips | 36.9 pips |
6.12 USD | 5.66 USD | |
| USDHUFUS Dollar/Hungarian Forint | 62.7 pips | 39.5 pips |
19.89 USD | 12.53 USD | |
| USDHKDUS Dollar/Hong Kong Dollar | 4.3 pips | 3.3 pips |
5.48 USD | 4.21 USD | |
| EURNOKEuro/Norwegian Krone | 158.2 pips | 148.2 pips |
16.81 USD | 15.74 USD | |
| EURPLNEuro/Polish Zloty | 69.6 pips | 49.6 pips |
18.36 USD | 13.09 USD | |
| EURSEKEuro/Swedish Krona | 120.6 pips | 102.0 pips |
12.30 USD | 10.41 USD | |
| EURTRYEuro/Turkish Lira | 740.0 pips | 680.0 pips |
15.17 USD | 13.94 USD | |
| EURSGDEuro/Singapore Dollar | 19.5 pips | 11.7 pips |
15.31 USD | 9.19 USD | |
| EURZAREuro/South African Rand | 222.7 pips | 152.7 pips |
13.72 USD | 9.41 USD | |
| EURDKKEuro/Danish Krone | 44.1 pips | 39.1 pips |
6.76 USD | 6.00 USD | |
| EURHKDEuro/Hong Kong Dollar | 58.8 pips | 43.9 pips |
7.50 USD | 5.60 USD | |
| EURHUFEuro/Hungarian Forint | 38.4 pips | 26.5 pips |
12.18 USD | 8.41 USD | |
| GBPNOKBritish Pound/Norwegian Krone | 207.9 pips | 187.9 pips |
22.09 USD | 19.96 USD | |
| GBPSEKBritish Pound/Swedish Krona | 153.1 pips | 132.9 pips |
15.62 USD | 13.56 USD | |
| GBPSGDBritish Pound/Singapore Dollar | 33.8 pips | 23.8 pips |
26.54 USD | 18.69 USD | |
| GBPDKKBritish Pound/Danish Krone | 116.4 pips | 106.1 pips |
17.86 USD | 16.28 USD | |
| CHFSGDSwiss Franc/Singapore Dollar | 30.4 pips | 23.4 pips |
23.87 USD | 18.37 USD | |
| NZDCADNew Zealand Dollar/Canadian Dollar | 4.4 pips | 3.1 pips |
3.13 USD | 2.21 USD | |
| NZDCHFNew Zealand Dollar/Swiss Franc | 4.6 pips | 2.5 pips |
5.62 USD | 3.05 USD | |
| NZDSGDNew Zealand Dollar/Singapore Dollar | 29.9 pips | 14.5 pips |
23.47 USD | 11.38 USD |
Other trading conditions can be checked in your XM Member Area under “Trading Instruments.”
XM Precious Metals Spread Table
The latest spreads and spread costs for precious metals such as GOLD available to trade on XM. Just like Forex products, all data is updated automatically every day at 19:20, and lot sizes and base currencies can be freely configured.
| Currency Pair | Standard | Ultra Low |
|---|---|---|
| GOLDGold/US Dollar | 5.1 pips | 2.9 pips |
5.10 USD | 2.90 USD | |
| SILVERSilver/US Dollar | 6.6 pips | 4.9 pips |
33.00 USD | 24.50 USD | |
| XAUEURGold/Euro | 8.0 pips | 6.0 pips |
9.17 USD | 6.88 USD | |
| XPDUSDPalladium Spot | 72.0 pips | 50.0 pips |
7.20 USD | 5.00 USD | |
| XPTUSDPlatinum Spot | 53.0 pips | 41.0 pips |
5.30 USD | 4.10 USD | |
| PALLPalladium Futures | 100.1 pips | 100.1 pips |
10.01 USD | 10.01 USD | |
| PLATPlatinum Futures | 45.0 pips | 45.0 pips |
4.50 USD | 4.50 USD |
Other trading conditions can be checked in your XM Member Area under “Trading Instruments.”
XM Cryptocurrency Spread Table
The latest spreads and spread costs for cryptocurrencies such as Bitcoin available to trade on XM. Just like Forex products, all data is updated automatically every day at 19:20, and lot sizes and base currencies can be freely configured.
| Currency Pair | Standard | Ultra Low |
|---|---|---|
| BTCUSDBitcoin/US Dollar | 400.00 pips | 150.00 pips |
4.00 USD | 1.50 USD | |
| ETHUSDEthereum/US Dollar | 30.00 pips | 19.00 pips |
0.30 USD | 0.19 USD | |
| LTCUSDLitecoin/US Dollar | 3.70 pips | 3.20 pips |
0.37 USD | 0.32 USD | |
| XRPUSDRipple/US Dollar | 89.70 pips | 62.80 pips |
0.90 USD | 0.63 USD | |
| AAVEUSDAAVE/US Dollar | 17.20 pips | 11.90 pips |
1.72 USD | 1.19 USD | |
| ADAUSDCardano/US Dollar | 15.50 pips | 11.10 pips |
0.16 USD | 0.11 USD | |
| ALGOUSDAlgorand/US Dollar | 13.00 pips | 9.00 pips |
0.13 USD | 0.09 USD | |
| AVAXUSDAvalanche/US Dollar | 9.80 pips | 6.90 pips |
0.10 USD | 0.07 USD | |
| AXSUSDAxie Infinity/US Dollar | 1.40 pips | 1.00 pips |
0.14 USD | 0.10 USD | |
| BATUSDBasic Attention Token/US Dollar | 9.50 pips | 6.60 pips |
0.10 USD | 0.07 USD | |
| BTCEURBitcoin/Euro | 1,650.00 pips | 1,150.00 pips |
18.91 USD | 13.18 USD | |
| BTCGBPBitcoin/British Pound | 2,150.00 pips | 1,750.00 pips |
28.74 USD | 23.39 USD | |
| COMPUSDCompound/US Dollar | 2.60 pips | 1.80 pips |
0.26 USD | 0.18 USD | |
| ENJUSDEnjin/US Dollar | 3.90 pips | 2.80 pips |
0.04 USD | 0.03 USD | |
| BCHUSDBitcoin Cash/US Dollar | 22.90 pips | 16.20 pips |
2.29 USD | 1.62 USD | |
| ETHEUREthereum/Euro | 130.00 pips | 90.00 pips |
1.49 USD | 1.03 USD | |
| ZRXUSD0x/US Dollar | 11.60 pips | 8.20 pips |
0.12 USD | 0.08 USD | |
| ETHGBPEthereum/British Pound | 130.00 pips | 105.00 pips |
1.74 USD | 1.40 USD | |
| FETUSDFetch.AI/US Dollar | 91.60 pips | 62.30 pips |
0.92 USD | 0.62 USD | |
| GRTUSDThe Graph/US Dollar | 3.20 pips | 2.40 pips |
0.03 USD | 0.02 USD | |
| LINKUSDChainlink/US Dollar | 12.20 pips | 8.80 pips |
1.22 USD | 0.88 USD | |
| MATICUSDPolygon/US Dollar | 16.10 pips | 11.50 pips |
0.16 USD | 0.12 USD | |
| OMGUSDOMG Network/US Dollar | No trading | No trading |
| No trading | No trading | |
| SKLUSDSKL Network/US Dollar | No trading | No trading |
| No trading | No trading | |
| SNXUSDSynthetix/US Dollar | 0.70 pips | 0.50 pips |
0.70 USD | 0.50 USD | |
| SOLUSDSolana/US Dollar | 6.60 pips | 4.50 pips |
0.66 USD | 0.45 USD | |
| STORJUSDStorj/US Dollar | 3.10 pips | 2.30 pips |
0.31 USD | 0.23 USD | |
| SUSHIUSDSushiSwap/US Dollar | 0.50 pips | 0.40 pips |
0.50 USD | 0.40 USD | |
| UMAUSDUMA/US Dollar | 0.20 pips | 0.10 pips |
2.00 USD | 1.00 USD | |
| UNIUSDUniswap/US Dollar | 6.10 pips | 4.10 pips |
0.61 USD | 0.41 USD | |
| XLMUSDStellar/US Dollar | 25.20 pips | 17.50 pips |
0.25 USD | 0.18 USD | |
| 1INCHUSD1inch/US Dollar | 0.30 pips | 0.20 pips |
3.00 USD | 2.00 USD | |
| APEUSDApeCoin/US Dollar | 1.90 pips | 1.40 pips |
0.19 USD | 0.14 USD | |
| APTUSDAptos/US Dollar | 8.20 pips | 5.80 pips |
0.08 USD | 0.06 USD | |
| ARBUSDArbitrum/US Dollar | 14.00 pips | 10.20 pips |
0.14 USD | 0.10 USD | |
| ATOMUSDCosmos/US Dollar | 2.10 pips | 1.50 pips |
0.21 USD | 0.15 USD | |
| BTGUSDBitcoin Gold/US Dollar | 31.10 pips | 22.50 pips |
3.11 USD | 2.25 USD | |
| CHZUSDChiliz/US Dollar | 1.90 pips | 1.30 pips |
0.19 USD | 0.13 USD | |
| CRVUSDCurve DAO Token/US Dollar | 4.50 pips | 3.20 pips |
0.45 USD | 0.32 USD | |
| DASHUSDDash/US Dollar | 5.50 pips | 3.80 pips |
5.50 USD | 3.80 USD | |
| DOGEUSDDogecoin/US Dollar | 11.90 pips | 8.20 pips |
1.19 USD | 0.82 USD | |
| DOTUSDPolkadot/US Dollar | 8.10 pips | 5.80 pips |
0.08 USD | 0.06 USD | |
| EGLDUSDMultiversX/US Dollar | 1.30 pips | 1.00 pips |
1.30 USD | 1.00 USD | |
| EOSUSDEOS/US Dollar | 1.90 pips | 1.40 pips |
1.90 USD | 1.40 USD | |
| ETCUSDEthereum Classic/US Dollar | 9.20 pips | 6.70 pips |
0.92 USD | 0.67 USD | |
| ETHBTCEthereum/Bitcoin | 1.60 pips | 1.10 pips |
1.37 USD | 0.94 USD | |
| FILUSDFilecoin/US Dollar | 10.10 pips | 7.10 pips |
1.01 USD | 0.71 USD | |
| FLOWUSDFlow/US Dollar | 0.20 pips | 0.10 pips |
0.20 USD | 0.10 USD | |
| ICPUSDInternet Computer/USD | 3.20 pips | 2.20 pips |
3.20 USD | 2.20 USD | |
| IMXUSDImmutable/USD | 1.70 pips | 1.20 pips |
0.17 USD | 0.12 USD | |
| LDOUSDLido DAO/USD | 5.20 pips | 3.70 pips |
0.52 USD | 0.37 USD | |
| LRCUSDLoopring/USD | 0.40 pips | 0.30 pips |
0.40 USD | 0.30 USD | |
| MANAUSDDecentraland/USD | 9.80 pips | 6.80 pips |
0.98 USD | 0.68 USD | |
| NEARUSDNEAR Protocol/USD | 25.80 pips | 18.10 pips |
2.58 USD | 1.81 USD | |
| OPUSDOptimism/USD | 1.40 pips | 0.90 pips |
0.14 USD | 0.09 USD | |
| SANDUSDThe Sandbox/USD | 5.90 pips | 4.20 pips |
0.06 USD | 0.04 USD | |
| SHIBUSDShiba Inu/USD | 0.70 pips | 0.50 pips |
0.70 USD | 0.50 USD | |
| STXUSDStacks/USD | 22.10 pips | 15.50 pips |
0.22 USD | 0.16 USD | |
| XTZUSDTezos/USD | 2.90 pips | 2.00 pips |
0.29 USD | 0.20 USD | |
| ZECUSDZcash/USD | 110.60 pips | 76.60 pips |
110.60 USD | 76.60 USD | |
| BTCJPYBitcoin/Japanese Yen | 1,040.00 pips | 450.00 pips |
6.62 USD | 2.86 USD |
Other trading conditions can be checked in your XM Member Area under “Trading Instruments.”
XM Oil & Gas Spread Table
The latest spreads and spread costs for crude oil and gas available to trade on XM. Just like Forex products, all data is updated automatically every day at 19:20, and lot sizes and base currencies can be freely configured.
| Currency Pair | Standard | Ultra Low |
|---|---|---|
| BRENTCashBrent Crude Oil | 0.5 pips | 0.3 pips |
0.50 USD | 0.30 USD | |
| OILCashUS Crude Oil | 0.5 pips | 0.4 pips |
0.50 USD | 0.40 USD | |
| NGASCashNatural Gas | 1.6 pips | 1.1 pips |
1.60 USD | 1.10 USD | |
| BRENTBrent Crude Oil | 0.5 pips | 0.5 pips |
0.50 USD | 0.50 USD | |
| GSOILLondon Gas Oil | 15.0 pips | 15.0 pips |
0.60 USD | 0.60 USD | |
| OILMnWTI Micro Crude Oil | 0.5 pips | 0.5 pips |
0.05 USD | 0.05 USD | |
| OILUS Crude Oil | 0.5 pips | 0.5 pips |
0.50 USD | 0.50 USD | |
| NGASNatural Gas | 3.3 pips | 3.3 pips |
3.30 USD | 3.30 USD |
Other trading conditions can be checked in your XM Member Area under “Trading Instruments.”
XM Stock Index Spread Table
The latest spreads and spread costs for stock indices available to trade on XM. XM’s stock indices come in both Futures and Cash versions, which use different symbols even for the same underlying product (e.g. “JP225-DEC22” and “JP225Cash”). Products with “○○Cash” in the name are “Cash” contracts, while those with a month abbreviation and number such as “○○-DEC25” are “Futures.” Note that in this listing, suffixes like “-DEC25” are omitted for simplicity.
Cash Stock Index Spread Table
| Currency Pair | Standard | Ultra Low |
|---|---|---|
| JP225CashNikkei Index | 0.8 pips | 0.6 pips |
0.01 USD | 0.00 USD | |
| US100CashNasdaq Index | 29.0 pips | 19.5 pips |
0.29 USD | 0.20 USD | |
| US30CashDow Jones Index | 60.0 pips | 40.0 pips |
0.60 USD | 0.40 USD | |
| US500CashS&P 500 Index | 8.0 pips | 6.5 pips |
0.08 USD | 0.07 USD | |
| US2000CashRussell 2000 Index | 10.0 pips | 5.5 pips |
0.10 USD | 0.06 USD | |
| EU50CashEuro STOXX 50 Index | 23.0 pips | 18.0 pips |
0.26 USD | 0.21 USD | |
| UK100CashFTSE 100 Index | 24.0 pips | 17.0 pips |
0.32 USD | 0.23 USD | |
| FRA40CashCAC 40 Index | 23.0 pips | 18.0 pips |
0.26 USD | 0.21 USD | |
| GER40CashDAX Index | 26.0 pips | 20.5 pips |
0.30 USD | 0.23 USD | |
| HK50CashHong Kong Stock Index | 1.1 pips | 0.8 pips |
0.14 USD | 0.10 USD | |
| IT40CashItaly Stock Index | 1.5 pips | 1.1 pips |
1.72 USD | 1.26 USD | |
| AUS200CashAustralia Stock Index | 30.0 pips | 23.0 pips |
0.21 USD | 0.16 USD | |
| NETH25CashNetherlands Stock Index | 4.5 pips | 3.7 pips |
0.05 USD | 0.04 USD | |
| SPAIN35CashSpain Stock Index | 0.7 pips | 0.7 pips |
0.80 USD | 0.80 USD | |
| SWI20CashSwitzerland Stock Index | 60.0 pips | 55.0 pips |
0.73 USD | 0.67 USD | |
| CA60CashS&P/TSX 60 Index | 20.4 pips | 18.8 pips |
0.15 USD | 0.13 USD | |
| China50CashFTSE China A50 Index | 75.0 pips | 75.0 pips |
0.75 USD | 0.75 USD | |
| ChinaHCashH-shares Index | 52.0 pips | 42.0 pips |
0.07 USD | 0.05 USD | |
| Sing30CashSingapore 30 Index | 4.8 pips | 3.2 pips |
0.04 USD | 0.03 USD | |
| SA40CashSouth Africa 40 Index | 1,050.0 pips | 700.0 pips |
0.65 USD | 0.43 USD | |
| GerMid50CashGerman Mid 50 Index | 250.0 pips | 200.0 pips |
2.87 USD | 2.29 USD | |
| GerTech30CashGerman Technology 30 Index | 420.0 pips | 400.0 pips |
4.81 USD | 4.59 USD | |
| TaiwanCashTaiwan Index | 22.0 pips | 17.5 pips |
0.22 USD | 0.18 USD |
Futures Stock Index Spread Table
Futures stock indices have a settlement date and do not incur swap charges, which is why their spreads are set wider compared to Cash contracts.
| Currency Pair | Standard | Ultra Low |
|---|---|---|
| FRA40CAC 40 Index | 37.0 pips | 37.0 pips |
0.42 USD | 0.42 USD | |
| JP225Nikkei Index | 1.5 pips | 1.5 pips |
0.01 USD | 0.01 USD | |
| UK100FTSE 100 Index | 55.0 pips | 55.0 pips |
0.74 USD | 0.74 USD | |
| SWI20Switzerland Stock Index | 78.0 pips | 78.0 pips |
0.95 USD | 0.95 USD | |
| US100Nasdaq Index | 65.0 pips | 65.0 pips |
0.65 USD | 0.65 USD | |
| GER40DAX Index | 57.5 pips | 57.5 pips |
0.66 USD | 0.66 USD | |
| US500S&P 500 Index | 15.5 pips | 15.5 pips |
0.16 USD | 0.16 USD | |
| EU50Euro STOXX 50 Index | 34.0 pips | 34.0 pips |
0.39 USD | 0.39 USD | |
| US30Dow Jones Index | 143.0 pips | 143.0 pips |
1.43 USD | 1.43 USD | |
| USDXDollar Index | 5.0 pips | 5.0 pips |
0.05 USD | 0.05 USD | |
| VIXVIX Index | 1.0 pips | 1.0 pips |
0.01 USD | 0.01 USD |
Other trading conditions can be checked in your XM Member Area under “Trading Instruments.”
XM Commodities Spread Table
The latest spreads and spread costs for commodities such as soybeans and corn available to trade on XM. Just like Forex products, all data is updated automatically every day at 19:20, and lot sizes and base currencies can be freely configured.
| Currency Pair | Standard | Ultra Low |
|---|---|---|
| COCOACocoa | 1.5 pips | 1.5 pips |
1.50 USD | 1.50 USD | |
| COFFECoffee | 5.5 pips | 5.5 pips |
5.50 USD | 5.50 USD | |
| COTTOCotton | 3.0 pips | 3.0 pips |
3.00 USD | 3.00 USD | |
| WHEATWheat | 16.5 pips | 16.5 pips |
0.66 USD | 0.66 USD | |
| HGCOPCopper | 6.4 pips | 6.4 pips |
1.28 USD | 1.28 USD | |
| CORNCorn | 10.0 pips | 10.0 pips |
0.40 USD | 0.40 USD | |
| SBEANSoybeans | 18.5 pips | 18.5 pips |
0.74 USD | 0.74 USD | |
| SUGARSugar | 0.6 pips | 0.6 pips |
0.60 USD | 0.60 USD |
Other trading conditions can be checked in your XM Member Area under “Trading Instruments.”
XM Turbo Stocks Spread Table
Turbo Stocks are day-trading stock products that cannot be held overnight. They carry no swap charges and can be traded with high leverage. Turbo Stock spreads are also updated automatically every day at 19:20, and lot sizes and base currencies can be freely configured.
| Currency Pair | Standard | Ultra Low |
|---|---|---|
| Apple_turboApple | 8.3 pips | No trading |
0.83 USD | No trading | |
| Alibaba_turboAlibaba | 2.2 pips | No trading |
0.22 USD | No trading | |
| AMD_turboAMD | 12.2 pips | No trading |
1.22 USD | No trading | |
| Adidas_turboAdidas | 3.9 pips | No trading |
0.45 USD | No trading | |
| Amazon_turboAmazon | 7.3 pips | No trading |
0.73 USD | No trading | |
| BP_turboBP (British Petroleum) | 14.3 pips | No trading |
0.19 USD | No trading | |
| Facebook_turboFacebook | 12.6 pips | No trading |
1.26 USD | No trading | |
| Google_turboGoogle | 8.1 pips | No trading |
0.81 USD | No trading | |
| Microsoft_turboMicrosoft | 13.5 pips | No trading |
1.35 USD | No trading | |
| Netflix_turboNetflix | 1.8 pips | No trading |
0.18 USD | No trading | |
| Nvidia_turboNvidia | 6.5 pips | No trading |
0.65 USD | No trading | |
| Tesla_turboTesla | 10.7 pips | No trading |
1.07 USD | No trading |
Trading hours and dividend information can be checked in your XM Member Area under “Trading Instruments.”
XM Thematic Index Spread Table
XM allows you to trade thematic indices that bundle stocks around specific themes. Major themes include AI, Electric Vehicles, and Blockchain — enabling you to invest in a broader trend without the need to pick individual stocks. Thematic index spreads are also updated automatically every day at 19:20, and lot sizes and base currencies can be freely configured.
| Currency Pair | Standard | Ultra Low |
|---|---|---|
| AI_INDXAI Theme Index | 201.0 pips | 144.0 pips |
2.01 USD | 1.44 USD | |
| ChinaInternetChina Internet | 116.0 pips | 77.0 pips |
1.16 USD | 0.77 USD | |
| ElectricVehiclesElectric Vehicles | 35.0 pips | 23.0 pips |
0.35 USD | 0.23 USD | |
| FAANGs_10FAANGs 10 | 225.0 pips | 160.0 pips |
2.25 USD | 1.60 USD | |
| Blockchain&NFTBlockchain & NFT | 137.0 pips | 90.0 pips |
1.37 USD | 0.90 USD | |
| LATAM_INDXLATAM Large-Cap Index | 121.0 pips | 88.0 pips |
1.21 USD | 0.88 USD | |
| TrumpWinnersTrump Winners Stock Index | 54.0 pips | 39.0 pips |
0.54 USD | 0.39 USD | |
| HarrisWinnersHarris Winners Stock Index | 50.0 pips | 35.5 pips |
0.50 USD | 0.36 USD | |
| Altcoins_INDXAltcoin Index | 32.0 pips | 25.0 pips |
0.32 USD | 0.25 USD |
Detailed information on each thematic index product can be checked in your XM Member Area under “Trading Instruments.”
Spreads on the Shares Account
Since Shares account spreads can be calculated straightforwardly, we’ve listed the stock lineup for each country and their average spreads below. Click the accordion menus to view the details.
▼ Click to expand
▼ Tap to expand
Trading Commissions on the XM Shares Account
How to Calculate Trading Commissions for US Stocks
How to Calculate Trading Commissions for UK Stocks
How to Calculate Trading Commissions for German Stocks
▼ Complete Guide to XM Swap Rates

Frequently Asked Questions About XM Spreads (Q&A)
We’ve compiled the most common questions traders ask about XM spreads right here. In Q&A format, we cover practical trading insights such as when spreads tend to widen, how to reduce your costs, and the differences between account types.
- Are there times when XM spreads tend to widen?
-
Yes. Spreads tend to widen around major economic data releases, over the weekend, and especially during the New York market close — which falls between 21:00–22:00 GMT (summer/daylight saving time) and 22:00–23:00 GMT (winter/standard time). Market conditions are unstable during these windows, so it is advisable to exercise caution when trading at those hours.
- Is there a way to reduce XM spread costs?
-
Yes — by using XM’s Traders Club and redeeming the XMC points you accumulate through trading as bonus funds. At the highest ELITE tier, you can receive approximately 6 USD per 1 lot of GOLD, which is equivalent to a 0.6 pip reduction in cost.
- What unit are XM spreads quoted in?
-
Spreads are quoted in “pips,” and their monetary value varies depending on the settlement currency. For USD-denominated accounts, 1 pip = 10 USD per lot. For example, in EUR/USD priced at 1.12345, the 4th decimal place (3) represents pips and the 5th decimal place (5) represents points.
- How do I calculate XM spread costs?
-
The formula is: “Spread (points) × Contract Size × Price Decimal Position × Lots Traded × Settlement Currency to USD Exchange Rate.” However, you can calculate this effortlessly using XM’s official online calculator on their website.
- What are the spreads like on the XM Ultra Low account?
-
The Ultra Low account offers spreads on major currency pairs starting from approximately 1.0 pips with zero commissions — keeping your true cost of trading low. You can also trade major pairs and Gold/Silver with Free Swap (no overnight charges). The trade-off is that this account type does not qualify for deposit bonuses.
- Which XM currency pairs have the tightest spreads?
-
EUR/USD and USD/JPY on the Ultra Low account have the tightest spreads, averaging 1.0 pips. Since XM uses a floating spread system, spreads may widen during major economic announcements or over the weekend.
- Are spreads different between XM CFD Futures and CFD Spot products?
-
Yes. CFD Spot products have narrower spreads than Futures, and also offer a wider range of instruments. You can check current spreads in the quotes window of MT4/MT5 or in your XM Member Area under “Trading Instruments.”
- Do XM spreads differ by account type?
-
Yes. The Standard and Ultra Low accounts have different spread structures. The Ultra Low account offers tighter spreads but does not come with bonuses. If minimising trading costs is your priority, go with the Ultra Low account. If you want access to bonuses and promotions, the Standard account is the better choice.
Financial Licence & Legal Information
XM is operated by XM Global Limited, registered with the Financial Services Commission (FSC) of Belize under the Securities Industry Act 2021 (Licence No. 000261/27).
Risk Warning
Trading Forex and CFDs carries a high risk of losing your invested capital. Please read and fully understand XM’s Risk Disclosure before trading.
Legal Documents — XM Global Limited
Company Name: XM Global Limited
Address: XM Global Limited, 63 Eve St, Belize City, Belize
Financial Instrument Trading Licence: Belize Financial Services Commission (FSC) Licence No. 000261/27
This website is operated by CHIHEWANLE Ltd. under a partnership agreement with XM (XM Global Limited) at the domain https://www.fxfan.club/. All personal data collected is held by XM (XM Global Limited).
Information Provider: CHIHEWANLE Ltd.
Registration No.: 24917404
Address: No.50 12F-3, Chenggong Rd, North District, Tainan City, Taiwan
- What Is a Spread in Forex Trading?
- What Are “Pips” — the Unit of Spread?
- Key Characteristics of XM Spreads
- Floating Spread System & Fractional Pip Pricing
- Spreads & Trading Fees That Vary by Account Type
- Ultra-Tight Spreads on the XM Ultra Low Account
- How to Calculate Spread Costs (Pip Value)
- Latest Spread Table & Spread Costs for All XM Products (Updated Daily)
- XM Major Currency Pairs Spread Table
- XM Minor & Cross Currency Pairs Spread Table
- XM Precious Metals Spread Table
- XM Cryptocurrency Spread Table
- XM Oil & Gas Spread Table
- XM Stock Index Spread Table
- XM Commodities Spread Table
- XM Turbo Stocks Spread Table
- XM Thematic Index Spread Table
- Spreads & Trading Commissions for the XM Shares Account
- Spreads on the Shares Account
- Trading Commissions on the XM Shares Account
- How to Calculate Trading Commissions for US Stocks
- How to Calculate Trading Commissions for UK Stocks
- How to Calculate Trading Commissions for German Stocks
- Frequently Asked Questions About XM Spreads (Q&A)