
Figures checked on 12 October 2026

All 28 pairs ▾Hide the 28 pairs ▴
| Pair | Side | Move |
|---|---|---|
| NZDUSD | SELL | −0.86% |
| AUDUSD | SELL | −0.86% |
| USDCAD | BUY | +0.75% |
| GBPUSD | SELL | −0.74% |
| EURUSD | SELL | −0.70% |
| USDJPY | BUY | +0.48% |
| NZDCHF | SELL | −0.48% |
| AUDCHF | SELL | −0.46% |
| NZDJPY | SELL | −0.42% |
| USDCHF | BUY | +0.41% |
| CADCHF3/3 | SELL | −0.40% |
| AUDJPY | SELL | −0.39% |
| CADJPY | SELL | −0.33% |
| GBPCHF | SELL | −0.32% |
| EURCHF | SELL | −0.29% |
| GBPJPY | SELL | −0.27% |
| EURJPY | SELL | −0.24% |
| NZDCAD | SELL | −0.15% |
| EURAUD | BUY | +0.13% |
| AUDCAD | SELL | −0.11% |
| EURNZD | BUY | +0.10% |
| GBPAUD | BUY | +0.07% |
| EURCAD | BUY | +0.06% |
| AUDNZD | SELL | −0.05% |
| GBPNZD | BUY | +0.05% |
| GBPCAD | BUY | +0.03% |
| EURGBP | SELL | −0.01% |
| CHFJPY | SELL | −0.01% |
The bars rank the eight currencies. +0.20% means that the currency rose 0.20% on average against the other seven over the period you chose.
The first card shows the pair of the strongest and the weakest currency. BUY means that the price of the pair rose over the period, and SELL means that it fell. "CAD strongest for 22 min" means that CAD has been the strongest currency for the last 22 minutes.
The next card shows the USD pairs with the same two currencies, which usually cost less to trade. Cheapest now is the trading account with the lowest cost for that pair, from the spread and commission of the last 24 hours. 3/3 marks a pair that moved the same way over 1 hour, 1 day and 5 days.
Each line starts at 0 on the left, at the start of the period, and shows how far the currency moved against the other seven. A line that keeps climbing is a move that has lasted. A line that turns flat is a move that has paused. USD is shown first. Tap a currency to show its line, and tap it again to show all eight.
How Do You Use the Currency Strength Meter?
Check the 1 day ranking first, then check 1 hour, and then use the chart to choose when to trade.
- The 1 day period
On the 1 day period, find the strongest and the weakest currency. This is the direction of the last 24 hours. - The 1 hour period
On the 1 hour period, check that the same currency is still the strongest and the other one is still the weakest. If they are not, the move has paused, so wait. - The chart
On the chart of the pair of those two currencies, choose the price and the time to trade.
Start from 1 day, because a longer period keeps the same strongest currency much more often. The table shows how often the strongest currency was still the strongest one hour later, over four trading days of the tool’s own data.
| Period | Still strongest 1 hour later |
|---|---|
| 1 hour | 11% |
| 2 hours | 31% |
| 4 hours | 44% |
| 8 hours | 58% |
| 12 hours | 62% |
| 1 day | 76% |
So the longer the period, the longer the strength lasts. 1 hour alone often shows a short move that does not last.
How Do You Read the Line Chart?
Use the line chart to see when the strongest currency gained its strength, because a rise that built up through the day lasts longer than a sudden jump.
- The 1 day period
On the 1 day period, the line of each currency starts at 0 on the left edge, which is 24 hours ago, so you see the whole day. - The strongest currency
On the chart, tap the strongest currency to show its line alone. - The shape of the line
On that line, see whether the rise came slowly through the day or mostly in the last hour.
The table shows how often the strongest currency on 1 day was still the strongest one hour later, by the shape of its line.
| Line | Still strongest 1 hour later |
|---|---|
| Rose all day | 78% |
| Jumped in last hour | 65% |
So a currency that climbed all day is a better choice than one that jumped just now, for example after a news release. Check the weakest currency in the same way, and look for a line that fell through the day.
Is the Pair in the First Card the Best One to Trade?
Not always, because the pair in the first card is usually a cross pair, and a cross pair usually costs more to trade than a pair with USD. On the 1 day period, the pair in the first card had USD in it only about 14% of the time.
Across the trading accounts that we track at four brokers, a cross pair cost about 1.5 times as much per lot as a USD pair. The difference adds up if you trade often, because you pay the spread on every trade.
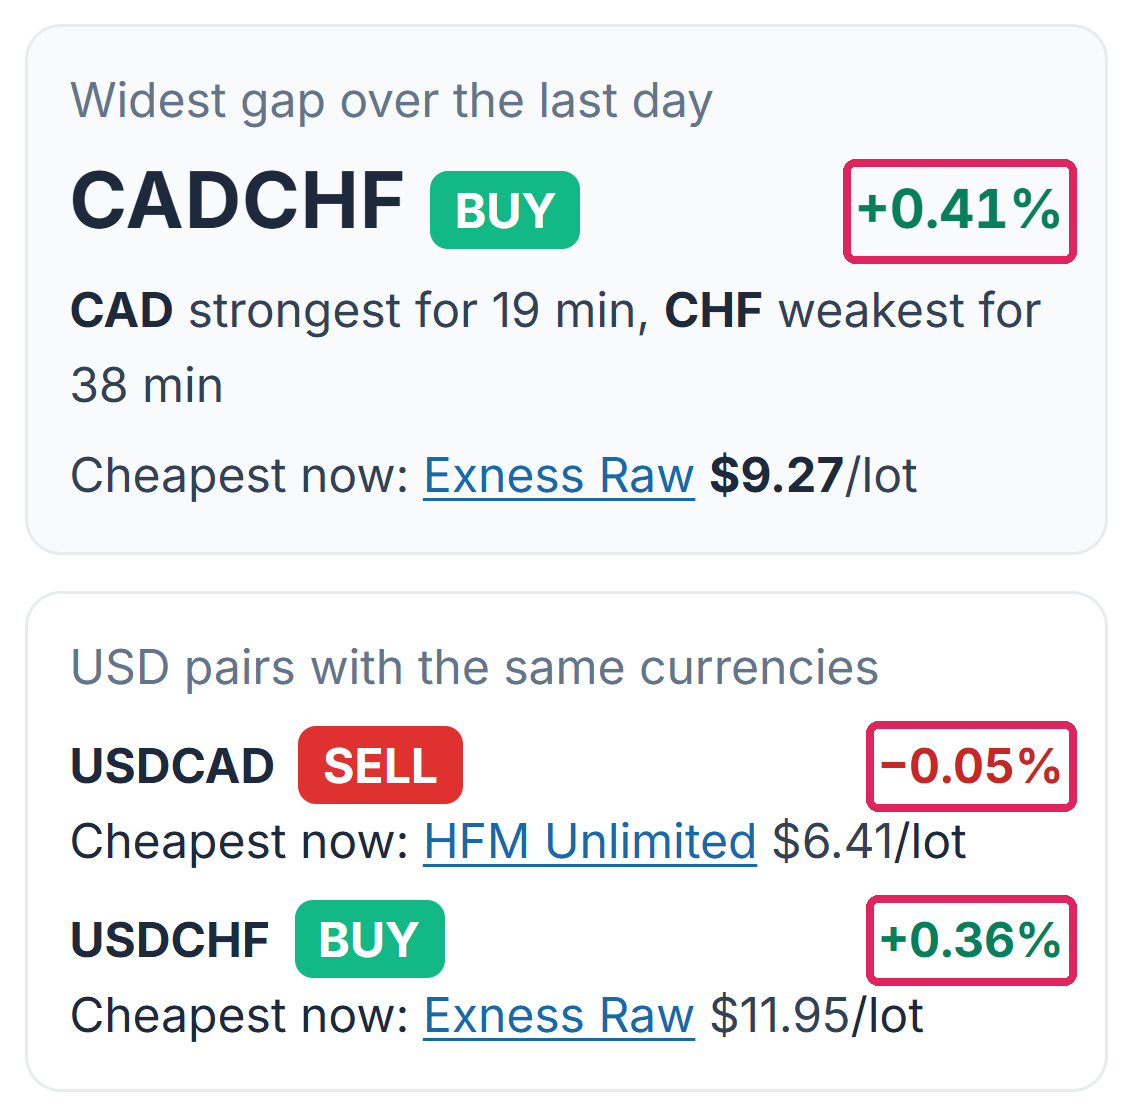
So also look at the card under it, USD pairs with the same currencies. Each line shows the move of the pair and its trading cost, so you can compare two things with the first card. The screenshots show the meter at 15:05 UTC on 12 October 2026.
The move
A USD pair with a similar % move follows the same move as the pair in the first card.
The cost
A USD pair with a lower Cheapest now figure costs less to trade.
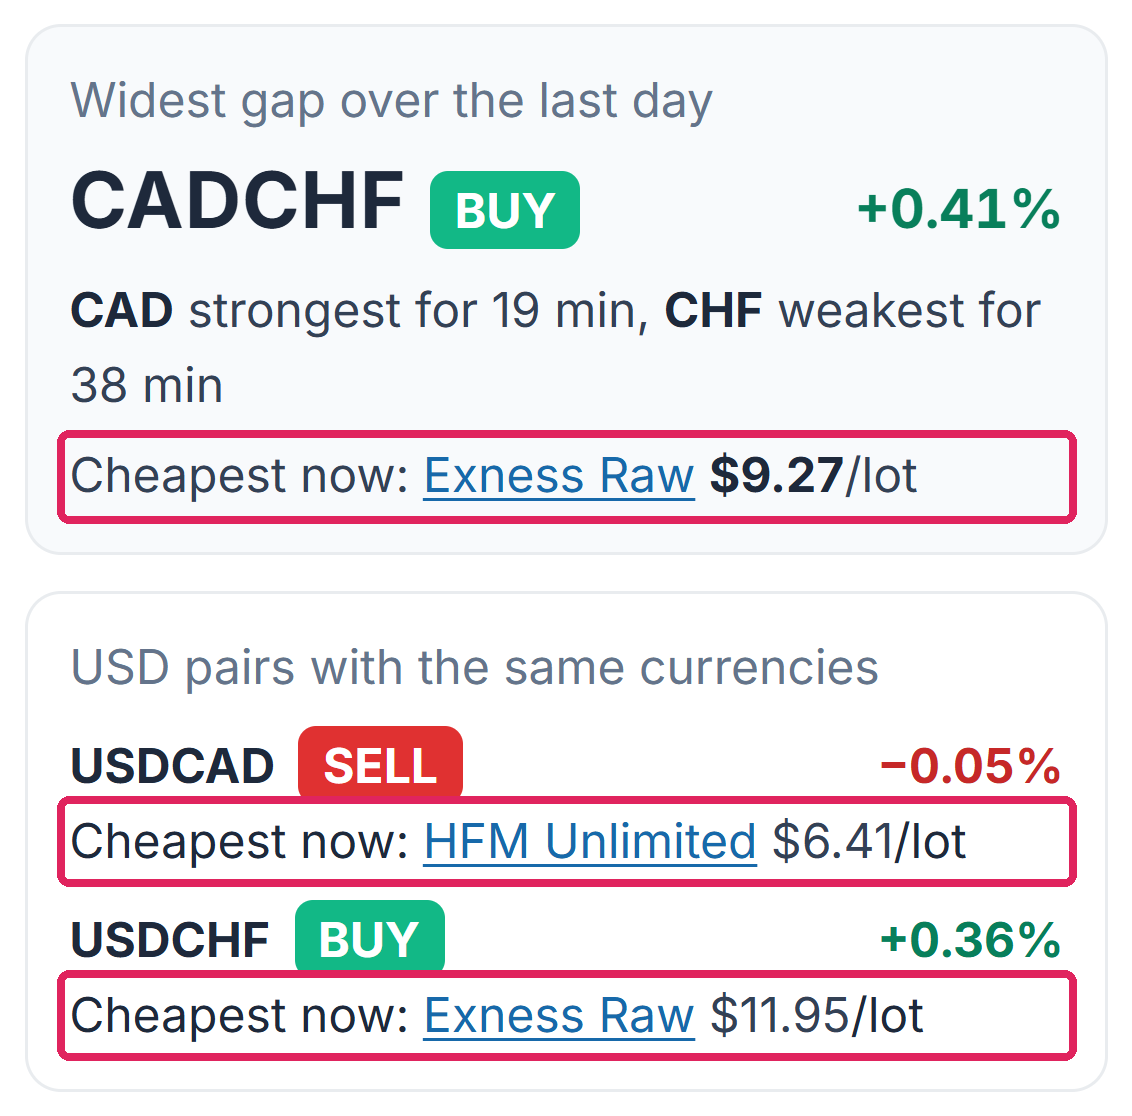
If a USD pair passes both checks, it is a cheaper way to trade the same move. In the screenshots, USDCHF followed the move but cost more, and USDCAD cost less but hardly moved. So at that moment, CADCHF itself was the cheaper way to trade the move.
The meter shows these two checks only for the time you look at it. Our best forex pairs to trade ranking makes a similar check over the last five trading days, so it shows which pairs usually move the most for their trading cost.
Once you have picked the pair, its cost still depends on the broker and the trading account. Our lowest spread comparison shows the cost of that pair at each broker. A rebate lowers the cost further, because it pays back part of the spread on every trade, and our rebate ranking shows which trading accounts cost the least after the rebate.
How Is Currency Strength Calculated?
The strength of a currency is its average price move against the other seven currencies over the period. For each of its seven pairs, the tool takes the % move from the start of the period to the latest one-minute price, and then takes the average.
GBP, an example
Sum of 7 pair moves+1.40%
Number of pairs÷ 7
Strength of GBP+0.20%
The ranking puts the eight currencies in order of their averages. The tool works this out again every minute from the one-minute prices of 28 pairs, and its data covers the last five days, so 5 days is the longest period.
Questions People Ask About the Currency Strength Meter
- Is the currency strength meter free?
-
Yes. It is free, and it runs in your browser with no sign-up and nothing to install. It works on a phone as well as on a computer, so you can add this page to your home screen and open it with one tap.
- Is there an MT4 or MT5 version?
-
No. The meter runs only on this page. It reads prices from our own MT5 data feed, so you see the same ranking on any device. Our MT4 and MT5 indicators are on the free trading tools page.
- How often does the meter update?
-
Every minute. The timer at the bottom of the screen shows the seconds until the next update. At the weekend the header shows “Market closed”, and the figures stay at the last prices of Friday.
- Which period is best for scalping?
-
1 hour, because it shows the moves of the last 60 minutes. However, the strongest currency on 1 hour changes often, so check that 1 day points the same way before you trade.
Which Tool Do You Need Next?
The lot size calculator gives the trade size for your risk, and the spread comparison shows what the pair costs. The best time to trade map shows the hours of the day when the pair moves the most for the spread you pay.
How the meter and the figures are worked out
How the meter works
- Prices
- The one-minute closing prices of 28 currency pairs from our MT5 data feed. The meter keeps the last five days and works the figures out again every minute.
- Strength
- For each pair, the % move is the latest price divided by the price at the start of the period, minus 1. The first currency of the pair gets the move and the second currency gets the opposite move. The strength of a currency is the average over its seven pairs. Equal values are listed in the order USD, JPY, EUR, GBP, AUD, NZD, CAD, CHF.
- Periods
- 1 hour is 60 minutes, 1 day is 1,440 minutes and 5 days is 7,200 minutes before the latest price.
- Cheapest now
- The 24-hour average spread plus commission of 1 lot, from our spread tools, on every trading account that we track. The lowest one is shown.
- JSON file
- https://fxfan.club/en/wp-content/uploads/ffc-strength/latest.json, updated every minute. Times are in UTC, and moves are in %.
The numbers in this guide
- Still strongest 1 hour later
- We repeated the meter’s calculation for every minute of its data for the four trading days to 07:08 UTC on 12 October 2026, 5,700 minutes in all, and compared the strongest currency at each minute with the strongest currency one hour later. The table adds periods between 1 hour and 1 day to show the trend. 5 days looks back further than these days, so it is not in the table.
- USD in the top pair
- The share of the same minutes in which the pair of the strongest and the weakest currency on the 1 day period was one of the seven pairs with USD.
- Cost of a cross pair
- The 24-hour average spread and commission of 1 lot on the 28 pairs, from our spread tools on 12 October 2026, on 14 trading accounts at XM, HFM, XS.com and Exness. On average, the 21 cross pairs cost 1.4 to 2.0 times as much as the seven USD pairs, depending on the trading account.
Figures checked on 12 October 2026. The ranking and the spreads change all the time, so use the meter and the spread comparison for today’s values.
Once your rebate account is open, link it to Forex FanClub. The member area lists every rebate payment day by day, across every broker you use. Registration is free and takes an email address.

Produced and operated by Forex FanClub
Person responsible: Hiroki Sakaida, founder of Forex FanClub
Hiroki Sakaida decides what our content and services cover and which features they offer. He also checks content and functionality and decides on revisions and publication. Our Content and Service Policy explains how we produce and check our content and services, including our use of AI.
Risk warning: Forex and CFD trading involve leverage, and you could lose all the money you invest. This article and tool provide information, not investment advice. The amounts shown are calculated from the collected data and do not guarantee the amounts that will apply to your own trades, or any future profit.
Affiliate disclosure: The broker pages linked from this page contain referral links. Forex FanClub receives referral commission based on registrations and trading through those links.